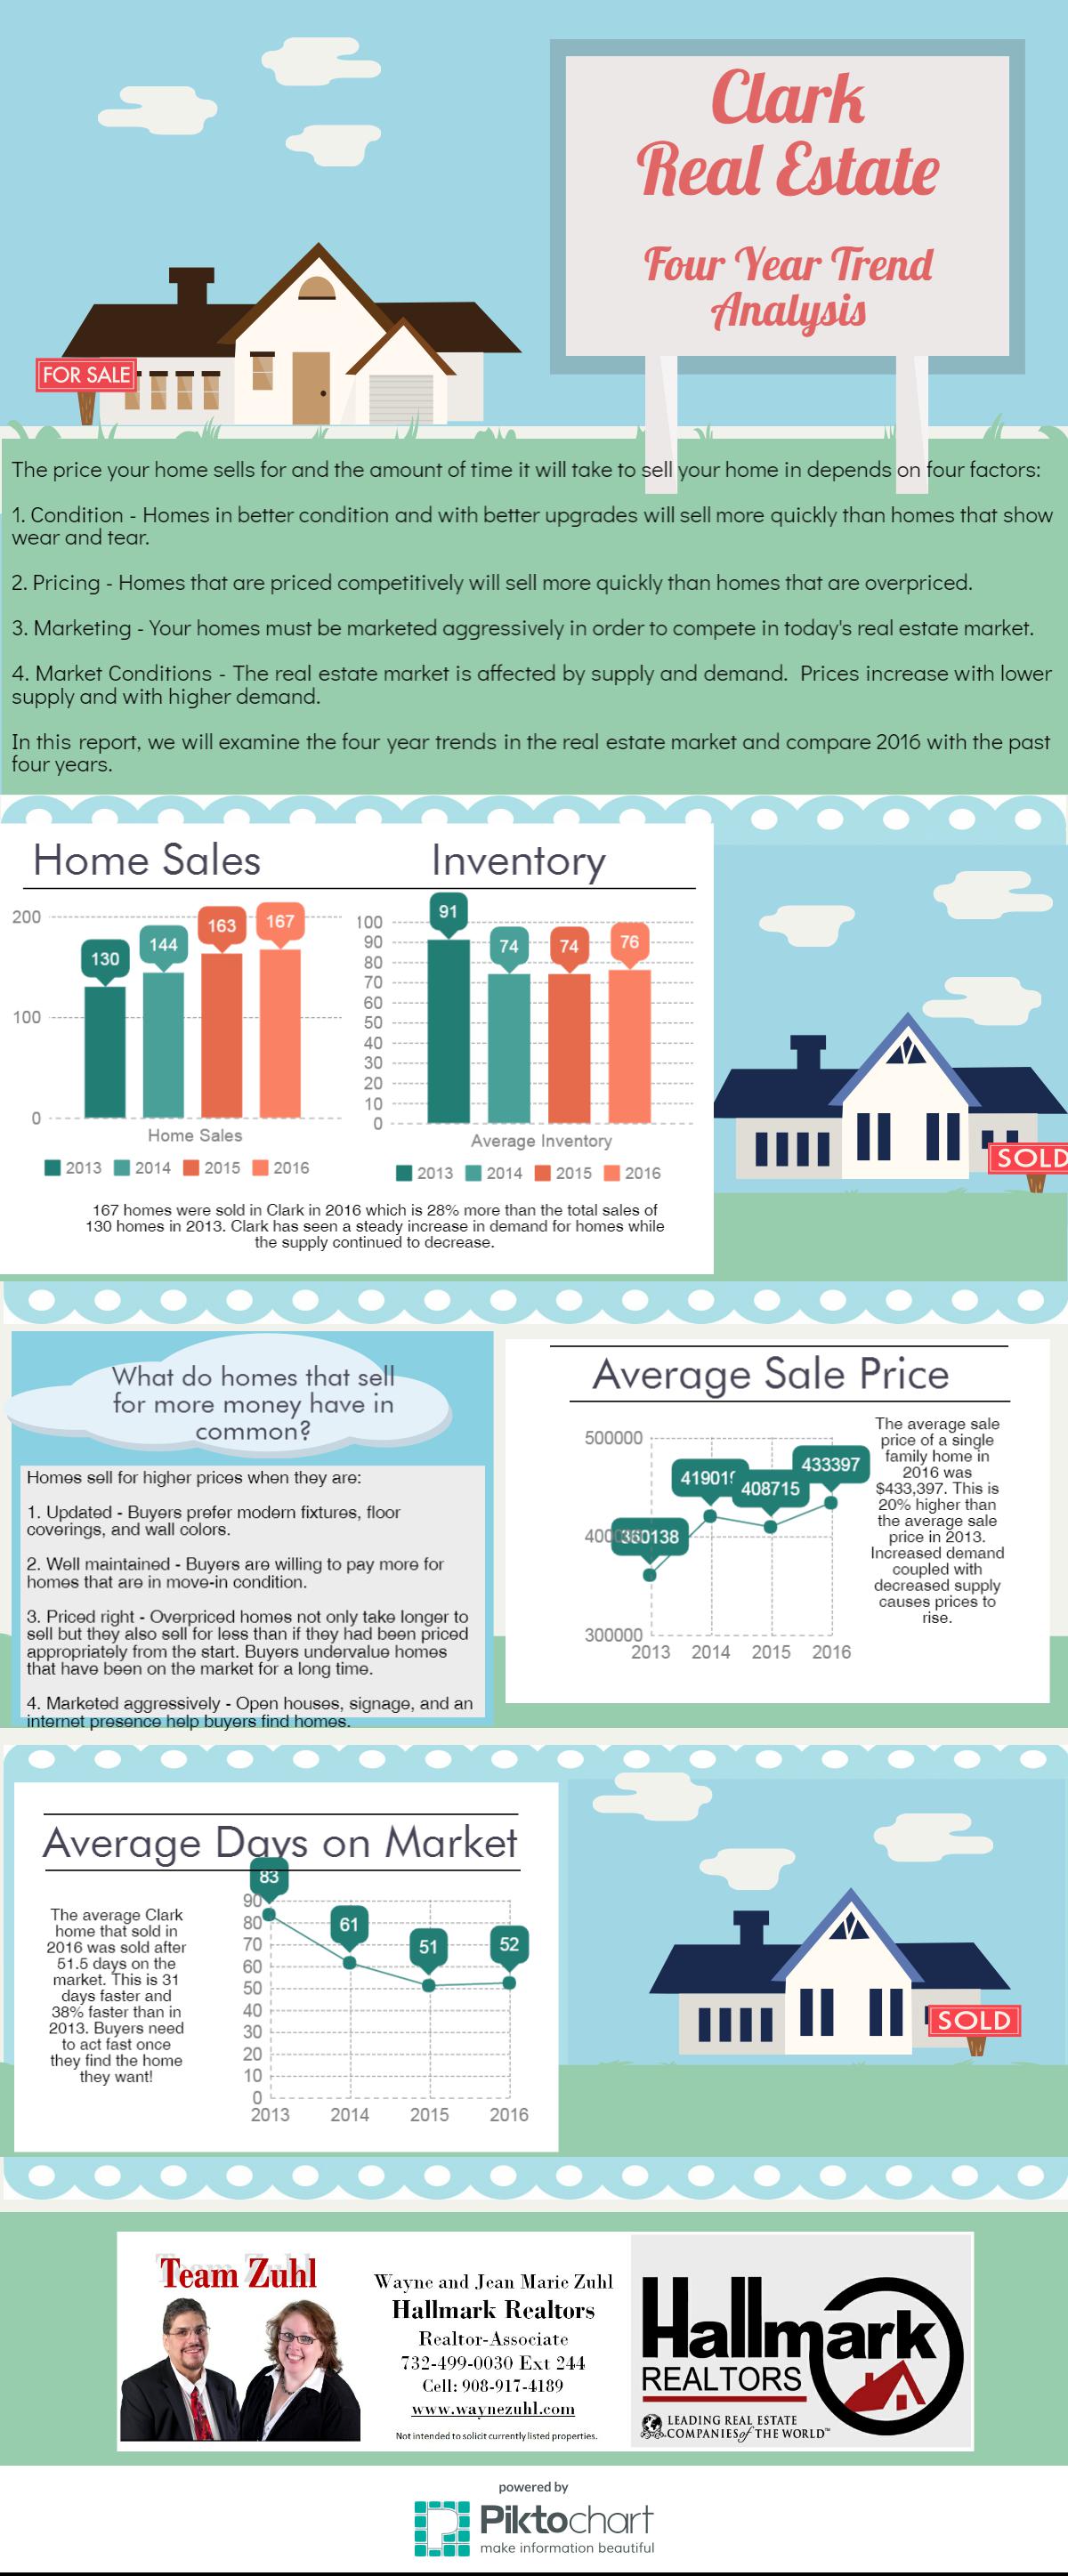


Clark real estate was hot in 2016. How does this compare to the previous several years?
- Inventory is down. The average inventory in 2013 was 91 homes. The average inventory in 2016 was 76 homes. Lower supply tends to drive prices up.
- Sales are up. 130 single family homes were sold in 2013 compared to 167 homes sold in 2016. Increased demand tends to drive prices up.
- Prices are up. The average sold home in Clark in 2013 was sold for $360,138. The average in 2016 was $433,397, an increase of 20%.
- Days on Market is down. The average sold home in Clark in 2013 was sold after 82.5 days as an active listing. In 2016, the average days on market was 51.5 days.