


Homeowners and home buyers in Linden are smart to learn about the real estate market to help make an informed decision about when to buy and sell a home in Linden .
Here’s what’s been happening lately.
Inventory:
- 36 homes were sold in Linden in September, compared to 41 homes sold in July.
- There are 136 homes offered for sale in Linden today – compared to the 12 month average of 171 homes and compared to 196 homes that were on the market in August of last year.
Active Listings Sold Listings September 2019 136 35 September 2018 196 33 12 month average 170.8 36.7
As inventory shrinks, demand for homes usually increases. This can help to raise prices and/or shorten the length of time homes are on the market.
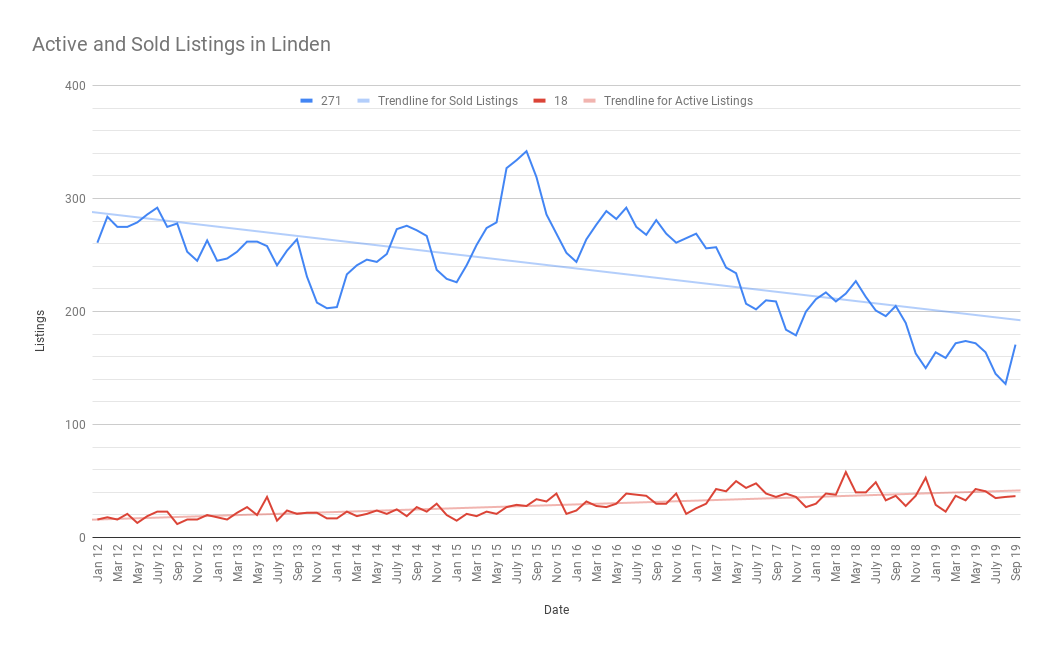
Inventory and sales are variable monthly as shown by the peaks and valleys in the graph above. Some variability can also be attributed to homes that are more desirable or less desirable than the average Linden home. Homes that are in exceptional condition or well priced won’t stay on the market long, whereas distressed properties or homes in disrepair stay around longer and cause data variations. Even conditions such as weather affect home sales – fewer buyers are out looking on days that are oppressively hot or rainy.
Realtors use an analysis called Months of Inventory to evaluate the real estate market. The Months of Inventory is equal to how long it would take to sell the existing inventory if no new houses were put on the market. When the Months of Inventory is below four months, realtors call it a seller’s market because the supply is relatively low so sellers have a stronger position in negotiations between a buyer and a seller. When the Months of Inventory is above seven months, realtors call it a buyer’s market because the supply is relatively high and buyers have a stronger position in negotiations. Months of Inventory between four and seven is considered a normal market with a good balance of buyers and sellers.
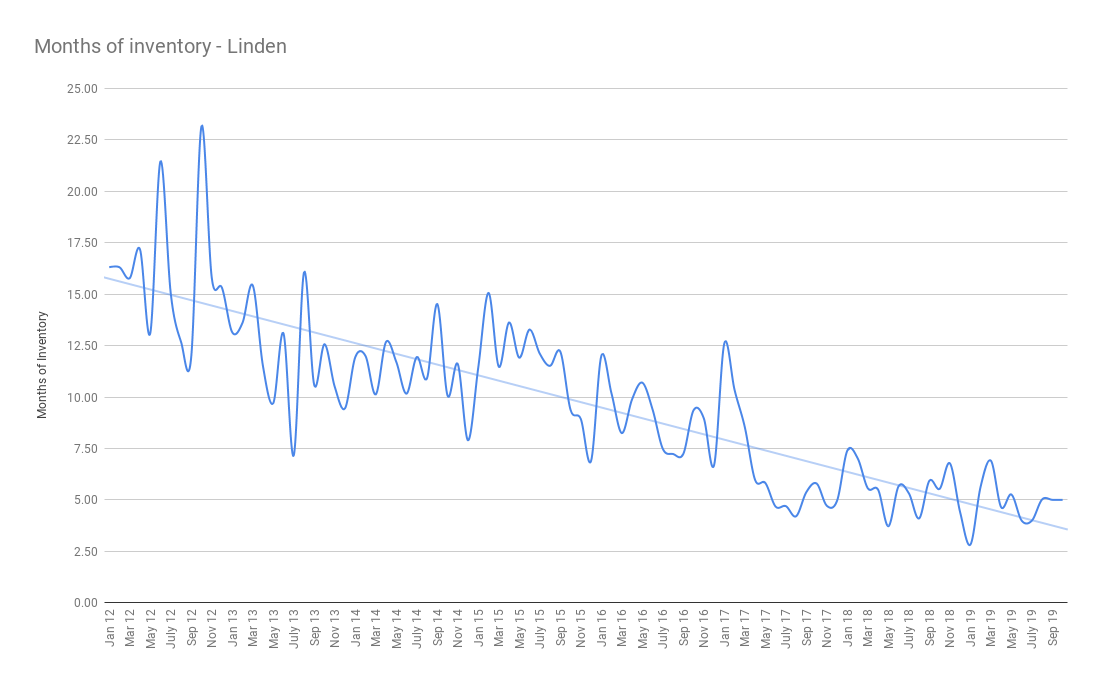
Linden is currently experiencing a normal market holding 5.01 months of inventory.
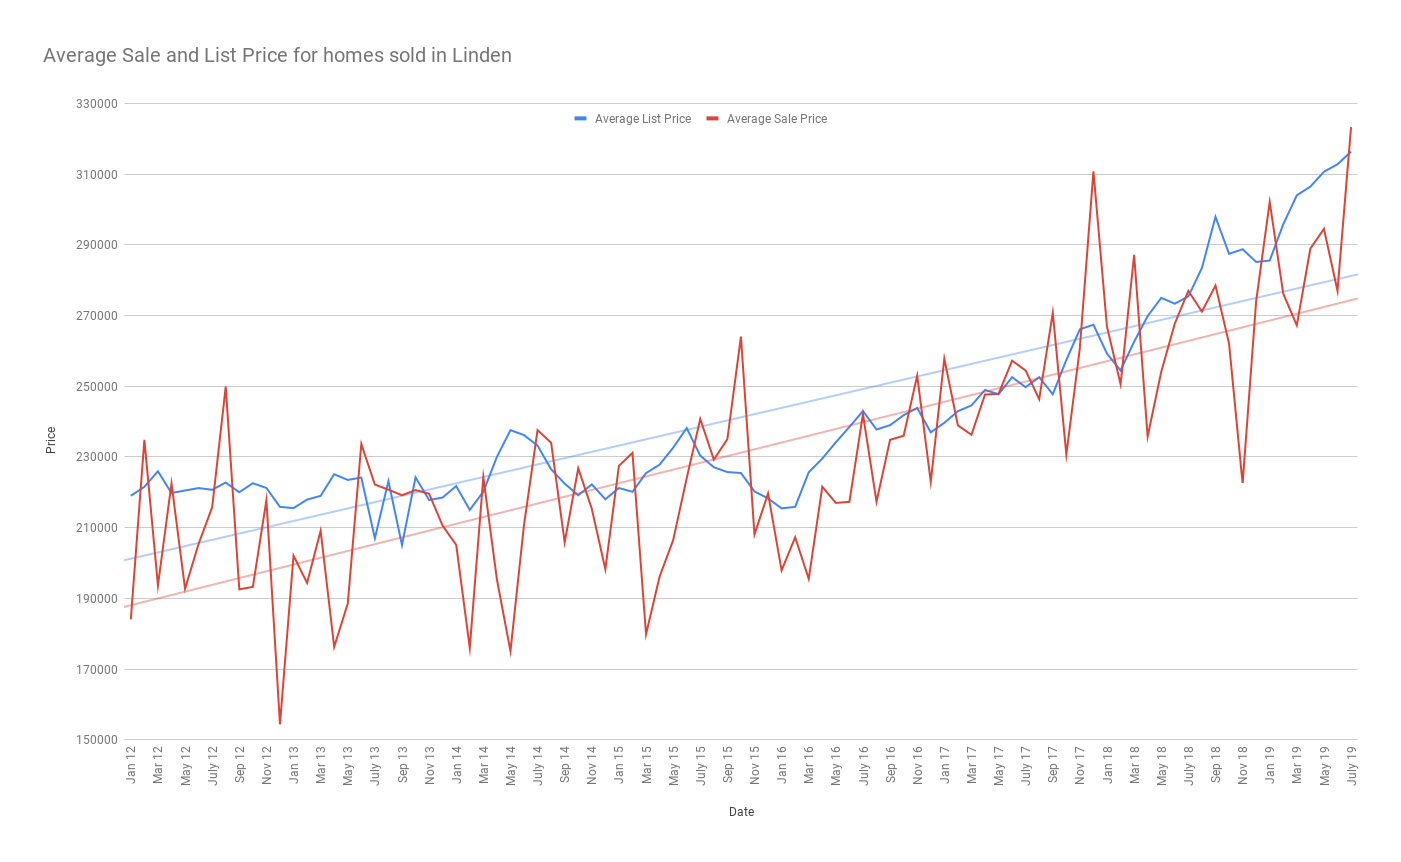
Prices:
- Average sale price in Linden in September was $314,180 – compared to September of 2018 when the average sale price was $278,483 and compared to the 12 month average sale price of $282,278.
- Average list price in Linden in September was $321,842 – compared to September of 2018 when the average list price was $297,931 and compared to the 12 month average list price of $300,921.
Average List Price Average Sale Price September 2019 $321,842 $314,180 September 2018 $297,931 $278,483 12 month average $300,921 $282,278
Linden has had a slow but steady improvement in prices for several years. The important thing to note about the graph is not the variability but rather the overall long term trend which is represented by the straight line which shows a healthy increase in home prices in Linden over the past seven years.
Many forecasters are predicting a turn around in the real estate market and are expecting a busy winter. Factors such as existing and pending home sales and buyer traffic indicate that we may be headed for a rebound.
Days on Market:
- In September , the average sold home in Linden was on the market for 44 days – compared to 68 days in August and 27 days in September of 2018.
-
Days on Market September 2019 44 September 2018 57 12 month average 58.8
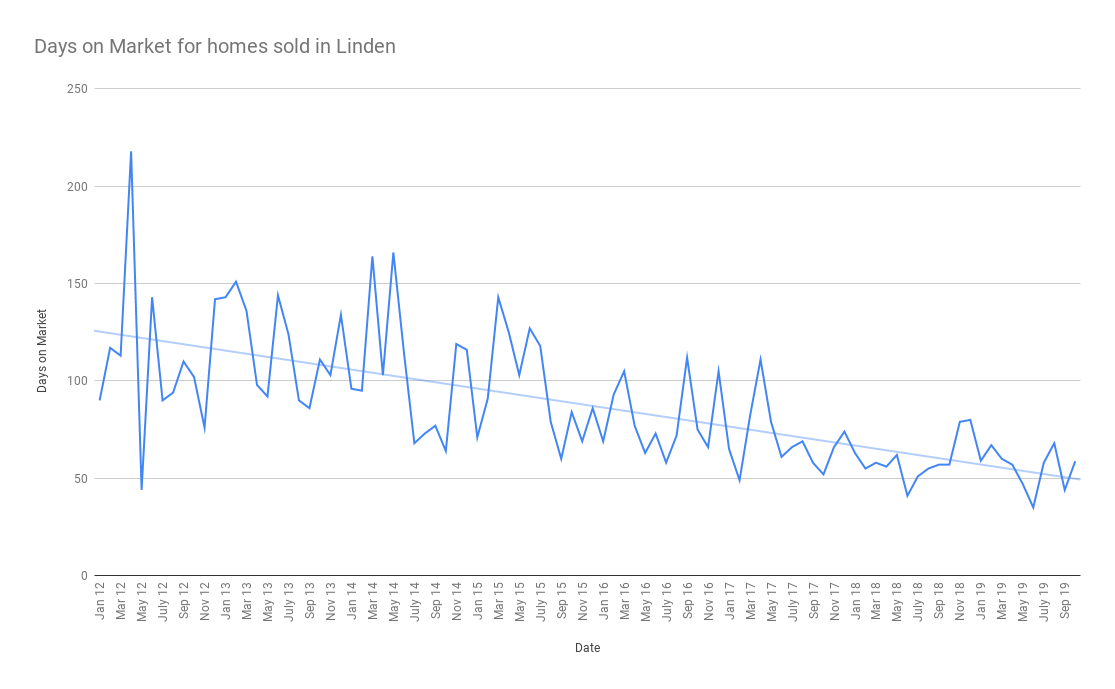
Sales appears to have slowed down after a relatively quick summer. Sellers who want to stand out in the inventory will have to price their homes well so that they can sell fast.
To learn what this means for buyers and sellers, please click here.
To see earlier market reports of Linden , please click here. If you’re thinking of buying or selling a Linden home, please call us at 908-917-4189.