Let’s take a look at how the real estate market in Clark performed in August of 2018.
Inventory:
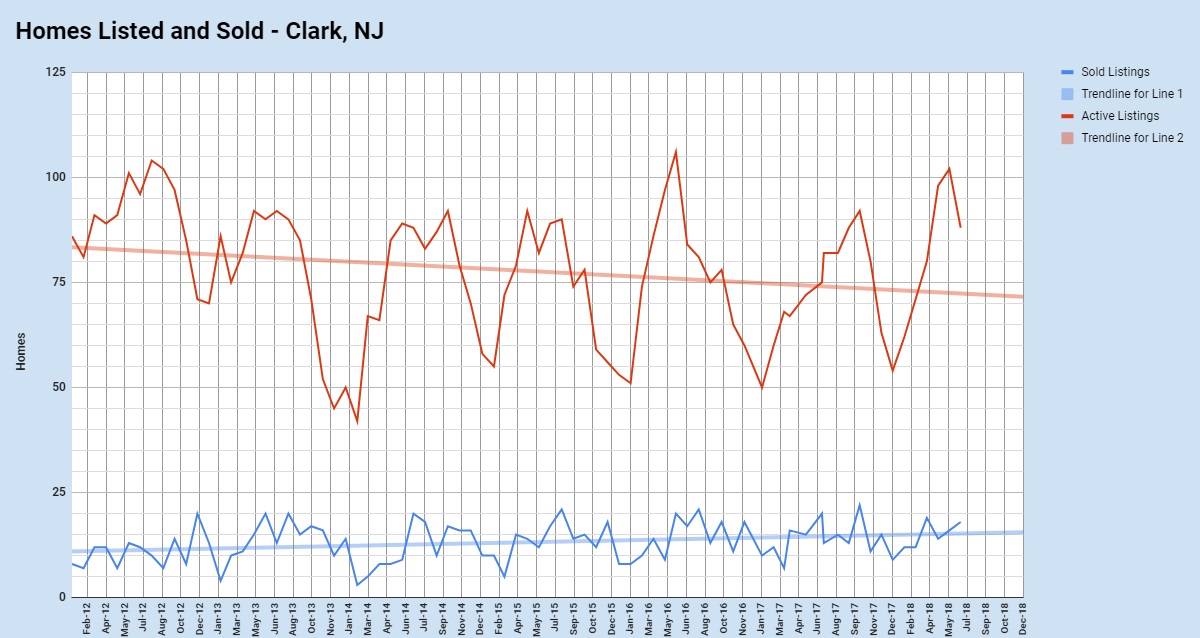
In July, 45 single family homes were sold and 88 homes were offered for sale, down from 102 homes offered for sale in June and compared to the 12 month average of 80 homes offered for sale. To search for listings, please click here.
More homes are offered for sale in the spring and summer than in the winter which explains the peaks and valleys in the red line above, the active listings over the last 6 years. The blue line represents sold listings in Clark over the last 6 years and the straight light blue line represents the trend in sales, eliminating the monthly variation and showing a long term trend of upwards sales. Buyers find Clark attractive, and homeowners benefit in the form of increasing sales prices and decreasing days on market. This is a seller’s market – there are more buyers than there are sellers in Clark – but there is some evidence that the market is slowing down in anticipation of the autumn.
Prices:
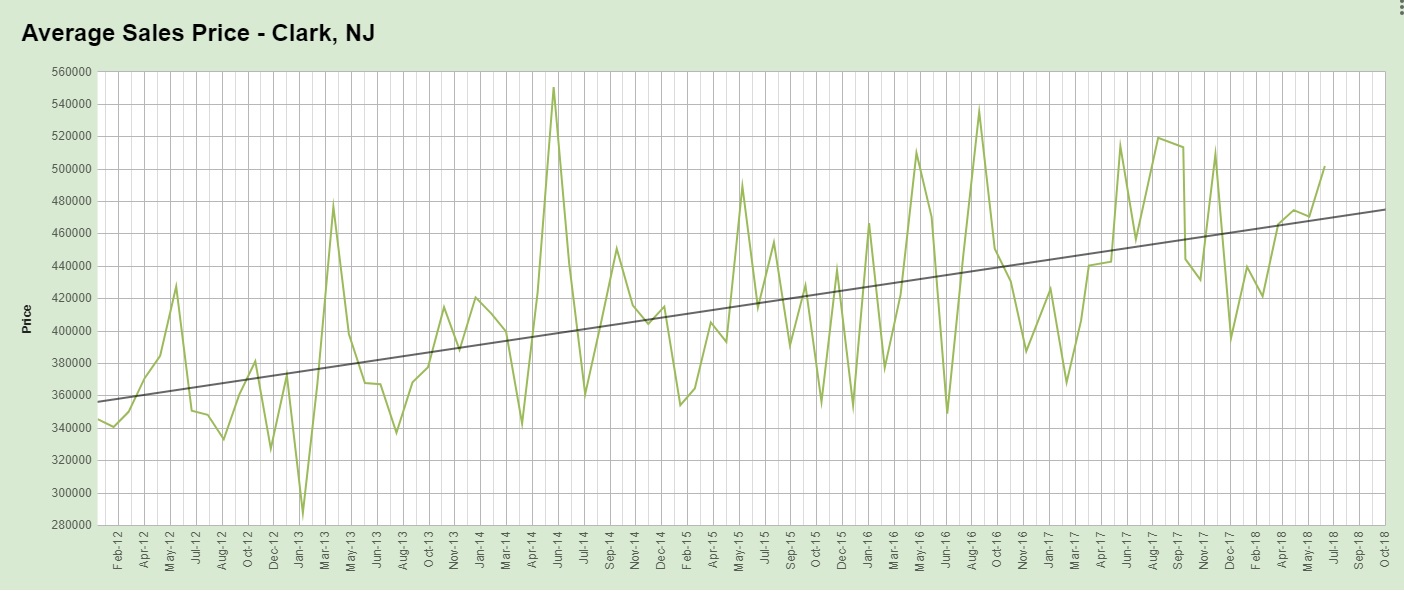
The average list price in Clark in July was $555,091 and the average sale price was $501,944, about 8% higher than the 12 month average and 6% lower than June of 2018. Homeowners are continuing to see a strong return on their real estate investment in Clark.
When you look at the graph of home prices in Clark, it’s obvious that there are tremendous variations from month to month. As a rule, prices are higher in the summer and lower in the winter due to supply and demand, but of course there are exceptions to this rule. One exception is extreme homes – those that sell for far below or far above the typical home sale in Clark. Short sales, foreclosures and homes in disrepair often sell for less than market average. The important thing to note in the graph is the straight black line which represents the long term trend, eliminating the seasonal variability and the variability brought on from extreme cases. The trend line continues to show a healthy improvement in prices in Clark over the past 6 years and the forecast is for prices to continue to increase. Homeowners are likely to see an increased return on investment as time goes on.
Days on Market:
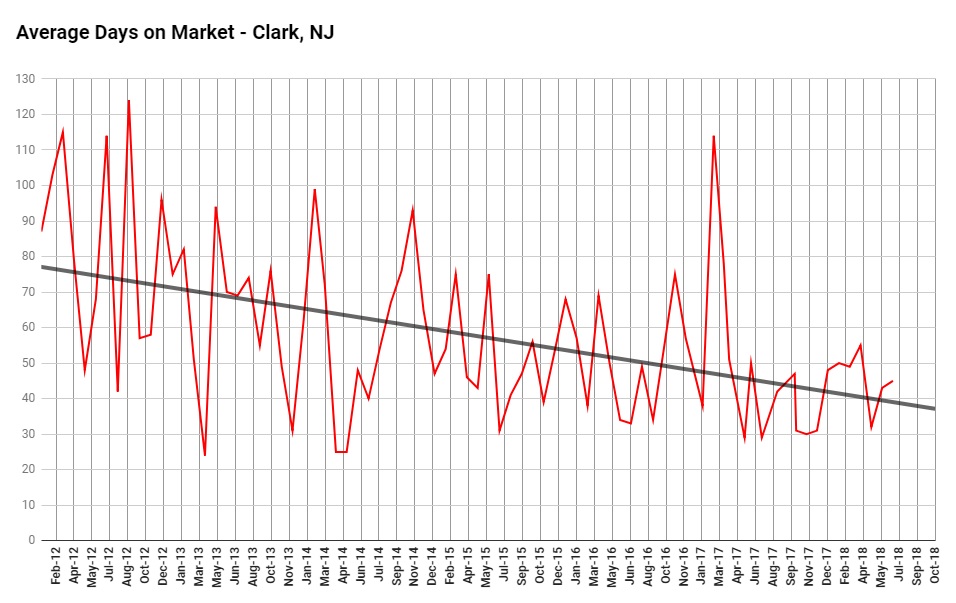
One of the questions we’re asked most often is how long it takes to sell a home in Clark. The average sold home in Clark in July was sold after only 45 days on the market whereas the average home sold over the past 12 months was sold in 41 days.
Of course, there are exceptions to this rule and the graph’s dramatic variations are indicators of this.
Homes sell faster when they are:
- In pristine updated condition,
- Are marketed aggressively, and
- Are priced correctly.
The black straight line on the graph is the trend line and it demonstrates the long term trend of the number of days a home takes to sell, eliminating mathematically the variations. The Clark real estate market demonstrates a strong improvement in sales time over the past 6 years.
What this means for buyers:
- Be educated. Learn what kind of home you want. Decide with your family members what you need in a home and what you want in a home.
- Be informed. Spend some time getting to know the inventory. Learn what homes look like in your price range. Learn what home features you can afford.
- Be ready. Have your pre-approval ready so that you can act quickly when you find your perfect home.
What this means for sellers:
- If you’re on the fence about selling your home, this may be the perfect opportunity to get the most money in the shortest amount of time.
- Even in a shrinking inventory situation, you’re still competing with other homes on the market. View the other homes that are offered for sale and make sure your home is the best one in its price range.
- Make your home available for potential buyers.
To read more about the real estate market in Clark, please read our earlier market reports here. For more information on how Team Zuhl can help you, please click here or call us at 908-917-4189.


