As we wrote earlier, we know that the short term impact on the Housing Market in NJ will see sales and prices fall, but rebound pretty quickly. But how about the Luxury Home Market (homes worth more than $1,000,000)? That market has been faltering for years so what is the outlook? Let’s take a closer look at it.
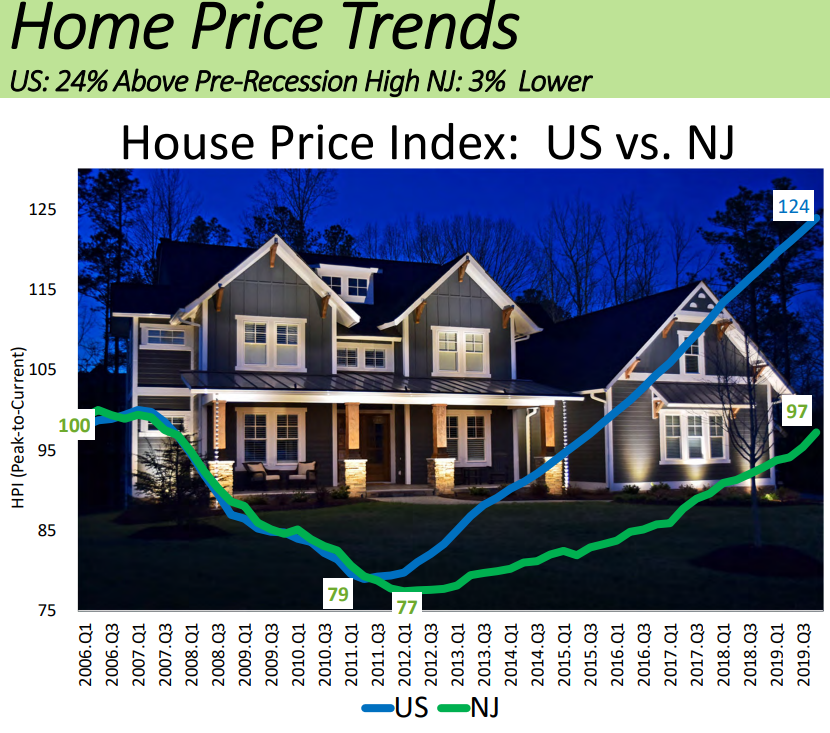 In 2006 the Real Estate Market saw a HUGE correction taking place when the economy went into the Great Recession. So if we look at this chart, you’ll see that New Jersey has been recovering much slower than the rest of the country. There are many reasons, including higher property taxes, cost of living, foreclosure backlogs and more. The divergence is very clear, you can see the green line (New Jersey) and the blue line (rest of the country) were matched pretty evenly from 2006 till the middle of 2011, then things start getting better at a faster rate in the rest of the US than in NJ. Most of the country’s housing markets recovered around 2016 and their median prices have risen 24% since 2016. But the picture in New Jersey is very different. New Jersey still hasn’t recovered to 2006 prices, in fact as of the end of 2019, the median home price in NJ was still only 97% of the 2006 price.
Another issue that faces the Luxury market is that there are far fewer buyers in that market than buyers 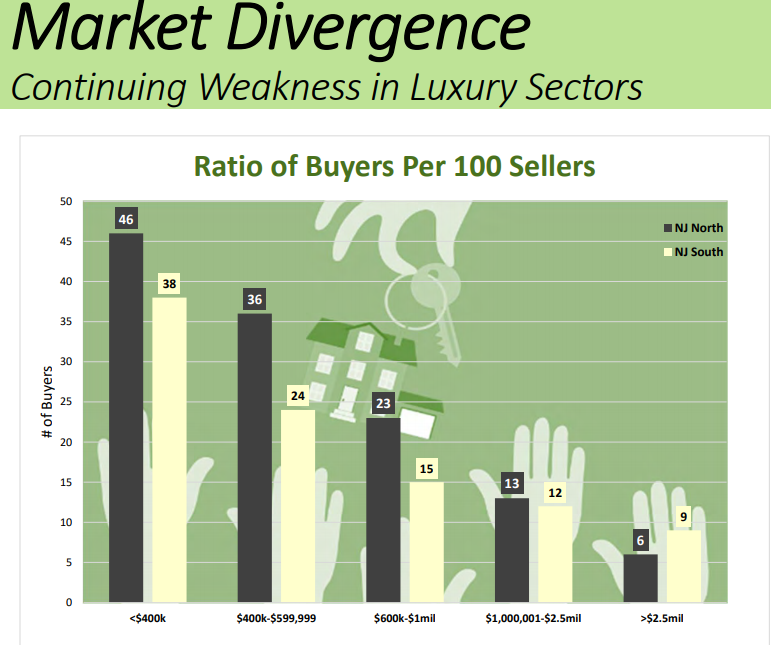 looking for homes priced below $400,000. There is even a subtle difference between the numbers of buyers in the northern part of the state as opposed to the southern part. You can see from the chart on the right that the only southern market that has more buyers than the northern markets is the $2.5 million-plus market. This is due to the luxury homes in the Jersey Shore areas. To better understand the chart, in the below $400,000 market in North Jersey there are 46 buyers for every 100 homes for sale, while in South Jersey there are only 38 buyers for every 100 homes for sale. So in the highest-priced market in North Jersey we 6 buyers for every 100 homes and 9 in South Jersey, again this is because of the desirability of shore properties. Looking at homes in the $1,000,000 to $2,500,000 range the ration increases only to 13:100 in North Jersey and 12:100 in South Jersey.
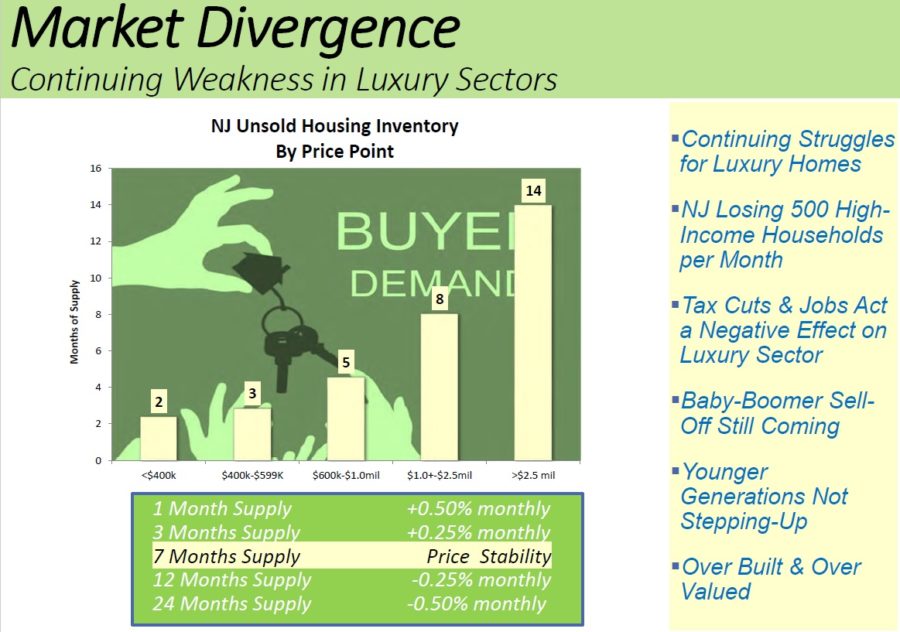 Another issue in this market is how long homes are on the market. As we have talked about in many other posts, the amount of time a home is on the market is proportional to how overpriced it is. Again this is well illustrated in the chart on the left. Lower-priced homes have only a 2 months supply, meaning that at the rate homes were selling, if no new homes came on the market, the current supply would sell out in 2 months.
  So we see that in the $1,000,000 to $2,500,000 market there is 8 months of unsold inventory and above $2.500,000 there are 14 months of unsold inventory!!! Why is there such disparity? Nearly 500 high-income households are leaving New Jersey and moving to other states every month. Many are leaving due to the cost of living, high property taxes and the high costs of running a business in New Jersey. Also, we’re seeing that many of the younger generations (Gen X, Gen Y and Millenials) are not moving up to luxury homes, especially in rural areas. Many are moving to Urban high rises as well as cluster housing where there is walkable access to transportation and shopping.
The above chart reflects our right pricing strategy, price your home 3-5% below  current market value and you’re likely to sell quickly and above asking price.
If you would like detailed information on your town or your home, contact Team Zuhl today! Remember with Team Zuhl everything we touch turns to SOLD!!! Email us at TeamZuhl@gmail.com, visit our website WayneZuhl.com or call at 908-917-4189.
Chart and graph Images Copyright 2020 Otteau Group, Inc. other images are copyright free.
All opinions, information and data provided is deemed reliable but is subject to errors and omissions. Not intended to solicit other Brokers’ clients. We cooperate with them fully.
